Build Performance Metrics
Stati includes a built-in performance metrics system that helps you understand and optimize your site’s build performance. This guide explains how to use it.
Quick Start
Enable metrics collection with the --metrics flag:
stati build --metrics
This will:
- Collect timing data for all build phases
- Track cache hit/miss rates
- Save a detailed JSON file to
.stati/metrics/
CLI Options
--metrics
Enable metrics collection. Can also be enabled via the STATI_METRICS=1 environment variable.
# Via flag
stati build --metrics

# Via environment variable
STATI_METRICS=1 stati build
--metrics-file <path>
Specify a custom output path for the metrics JSON file. The path is relative to .stati/metrics/:
# Writes to .stati/metrics/my-metrics.json
stati build --metrics --metrics-file my-metrics.json

# Writes to .stati/metrics/reports/build.json
stati build --metrics --metrics-file reports/build.json
--metrics-detailed
Include per-page timing information in the output:
stati build --metrics --metrics-detailed
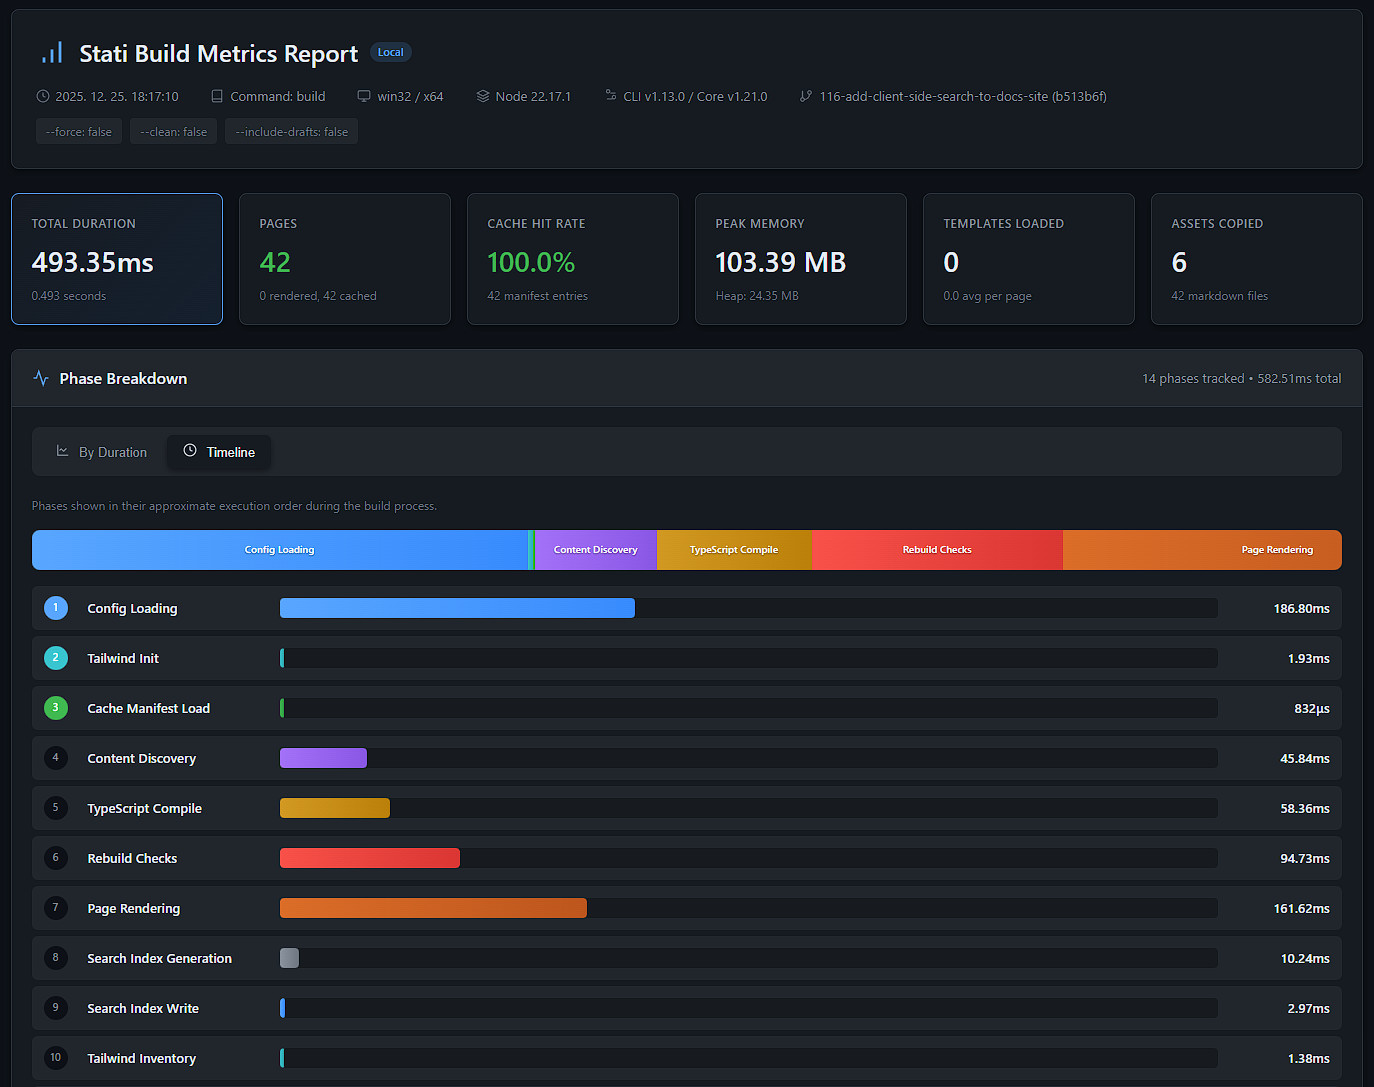
--metrics-html
Generate an interactive HTML report alongside the JSON file:
stati build --metrics --metrics-html
The HTML report provides:
- Visual summary cards for key metrics
- Interactive phase breakdown with click-to-expand descriptions
- Timeline view showing phases in execution order
- ISG cache performance visualization
- Per-page timing waterfall chart (when
--metrics-detailedis also used) - Embedded JSON data for debugging
You can combine all flags for the most comprehensive output:
stati build --metrics --metrics-detailed --metrics-html
Understanding the Output
JSON Output
Metrics are saved to .stati/metrics/build-<timestamp>.json:
{
  "schemaVersion": "1",
  "meta": {
    "timestamp": "2024-01-15T10:30:00.000Z",
    "ci": false,
    "nodeVersion": "22.0.0",
    "platform": "darwin",
    "cliVersion": "1.11.0",
    "coreVersion": "1.18.0",
    "command": "build",
    "flags": {
      "force": false,
      "clean": false
    }
  },
  "totals": {
    "durationMs": 1250,
    "peakRssBytes": 105381888,
    "heapUsedBytes": 52428800
  },
  "phases": {
    "configLoadMs": 50,
    "contentDiscoveryMs": 100,
    "navigationBuildMs": 25,
    "cacheManifestLoadMs": 10,
    "pageRenderingMs": 800,
    "assetCopyMs": 200,
    "cacheManifestSaveMs": 15
  },
  "counts": {
    "totalPages": 20,
    "renderedPages": 5,
    "cachedPages": 15,
    "assetsCopied": 10,
    "templatesLoaded": 18,
    "markdownFilesProcessed": 20
  },
  "isg": {
    "enabled": true,
    "cacheHitRate": 0.75,
    "manifestEntries": 20,
    "invalidatedEntries": 5
  }
}
Key Metrics Explained
Cache Hit Rate
The cache hit rate (isg.cacheHitRate) shows what percentage of pages were served from cache without re-rendering:
- 100%: All pages were cached (no changes detected)
- 0%: Full rebuild (all pages rendered)
- 50-90%: Incremental build (some pages changed)
A consistently low cache hit rate might indicate:
- ISG is disabled
- Content files are being modified unnecessarily
- Template changes are triggering full rebuilds
Phase Breakdown
The phases object shows how long each build phase took:
| Phase | Description |
|---|---|
configLoadMs |
Loading and parsing stati.config.ts |
contentDiscoveryMs |
Finding and parsing markdown files |
navigationBuildMs |
Building navigation tree from pages |
cacheManifestLoadMs |
Loading ISG cache manifest |
typescriptCompileMs |
Compiling TypeScript bundles |
pageRenderingMs |
Rendering pages (markdown + templates) |
shouldRebuildTotalMs |
Aggregate time checking if pages need rebuild |
renderPageTotalMs |
Aggregate time rendering pages |
fileWriteTotalMs |
Aggregate time writing HTML files to disk |
cacheEntryTotalMs |
Aggregate time updating cache entries |
searchIndexGenerationMs |
Generating search index JSON |
searchIndexWriteMs |
Writing search index to disk |
assetCopyMs |
Copying static assets |
cacheManifestSaveMs |
Saving updated cache manifest |
sitemapGenerationMs |
Generating sitemap.xml |
rssGenerationMs |
Generating RSS feeds |
tailwindInitMs |
Tailwind detection and inventory initialization |
tailwindInventoryMs |
Writing Tailwind inventory at end of build |
getDirectorySizeMs |
Calculating directory size for build stats |
lockAcquireMs |
Build lock acquisition |
lockReleaseMs |
Build lock release |
hookBeforeAllMs |
Time spent in beforeAll hook (if configured) |
hookAfterAllMs |
Time spent in afterAll hook (if configured) |
hookBeforeRenderTotalMs |
Total time spent in beforeRender hooks across all pages |
hookAfterRenderTotalMs |
Total time spent in afterRender hooks across all pages |
Note: Not all phases appear in every build. Only phases that actually run will be included in the metrics output. For example, hook timings are only recorded when the corresponding hooks are defined in your
stati.config.ts, and TypeScript compilation only runs when TypeScript bundles are configured.
Counts
The counts object tracks quantities processed during the build:
| Counter | Description |
|---|---|
totalPages |
Total number of pages discovered |
renderedPages |
Pages that were rendered (cache misses) |
cachedPages |
Pages served from cache (cache hits) |
assetsCopied |
Number of static assets copied |
templatesLoaded |
Total templates loaded across all rendered pages |
markdownFilesProcessed |
Number of markdown files processed |
Templates Loaded
The templatesLoaded counter tracks the total number of Eta templates (layouts and partials) loaded during the build. This is an accumulated total across all rendered pages - if 5 pages each load 4 templates, templatesLoaded will be 20.
When using --metrics-detailed, per-page template counts are also available in pageTimings:
{
  "pageTimings": [
    { "url": "/docs/intro", "durationMs": 75, "cached": false, "templatesLoaded": 4 },
    { "url": "/docs/guide", "durationMs": 60, "cached": false, "templatesLoaded": 4 },
    { "url": "/about", "durationMs": 0, "cached": true }
  ]
}
Note that cached pages don’t have a templatesLoaded property since no templates are rendered for them.
Memory Usage
peakRssBytes: Maximum resident set size during buildheapUsedBytes: V8 heap usage at the end of the build
High memory usage might indicate:
- Many large pages
- Memory-intensive templates
- Large static assets being processed
Using Metrics in CI
Enable metrics in CI to track build performance over time:
# .github/workflows/ci.yml
- name: Build with metrics
  run: stati build --metrics
  env:
    STATI_METRICS: '1'

- name: Upload metrics
  uses: actions/upload-artifact@v4
  with:
    name: build-metrics
    path: .stati/metrics/
Regression Detection
Compare metrics between builds to detect regressions:
# Get baseline
stati build --metrics --metrics-file baseline.json

# Make changes...

# Compare
stati build --metrics --metrics-file current.json

# Use jq to compare
jq -r '.totals.durationMs' baseline.json current.json
Programmatic Access
Access metrics programmatically in Node.js:
import { build } from '@stati/core';
import type { BuildResult, BuildMetrics } from '@stati/core';

const result: BuildResult = await build({
  metrics: { enabled: true, detailed: true }
});

if (result.buildMetrics) {
  const metrics: BuildMetrics = result.buildMetrics;
  console.log(`Build took ${metrics.totals.durationMs}ms`);
  console.log(`Cache hit rate: ${metrics.isg.cacheHitRate * 100}%`);

  // Per-page timings (when detailed: true)
  if (metrics.pageTimings) {
    for (const page of metrics.pageTimings) {
      if (page.cached) {
        console.log(`${page.url}: cached`);
      } else {
        // templatesLoaded shows partials + layout loaded for this page
        console.log(`${page.url}: ${page.durationMs}ms, ${page.templatesLoaded} templates`);
      }
    }
  }
}